x <- c("berry", "burry", "berry", "berry", "berry",
"bury", "berry", "burry", "berry", "berry")
n <- length(x)
B <- 1000
boot_props <- rep(NA, B)
for(b in 1:B){
x_b <- sample(x, size = n, replace = TRUE)
boot_props[b] <- sum(x_b == "berry")/n
}
library(tidyverse)
boot_df <- data.frame(bootstrapped_props = boot_props)
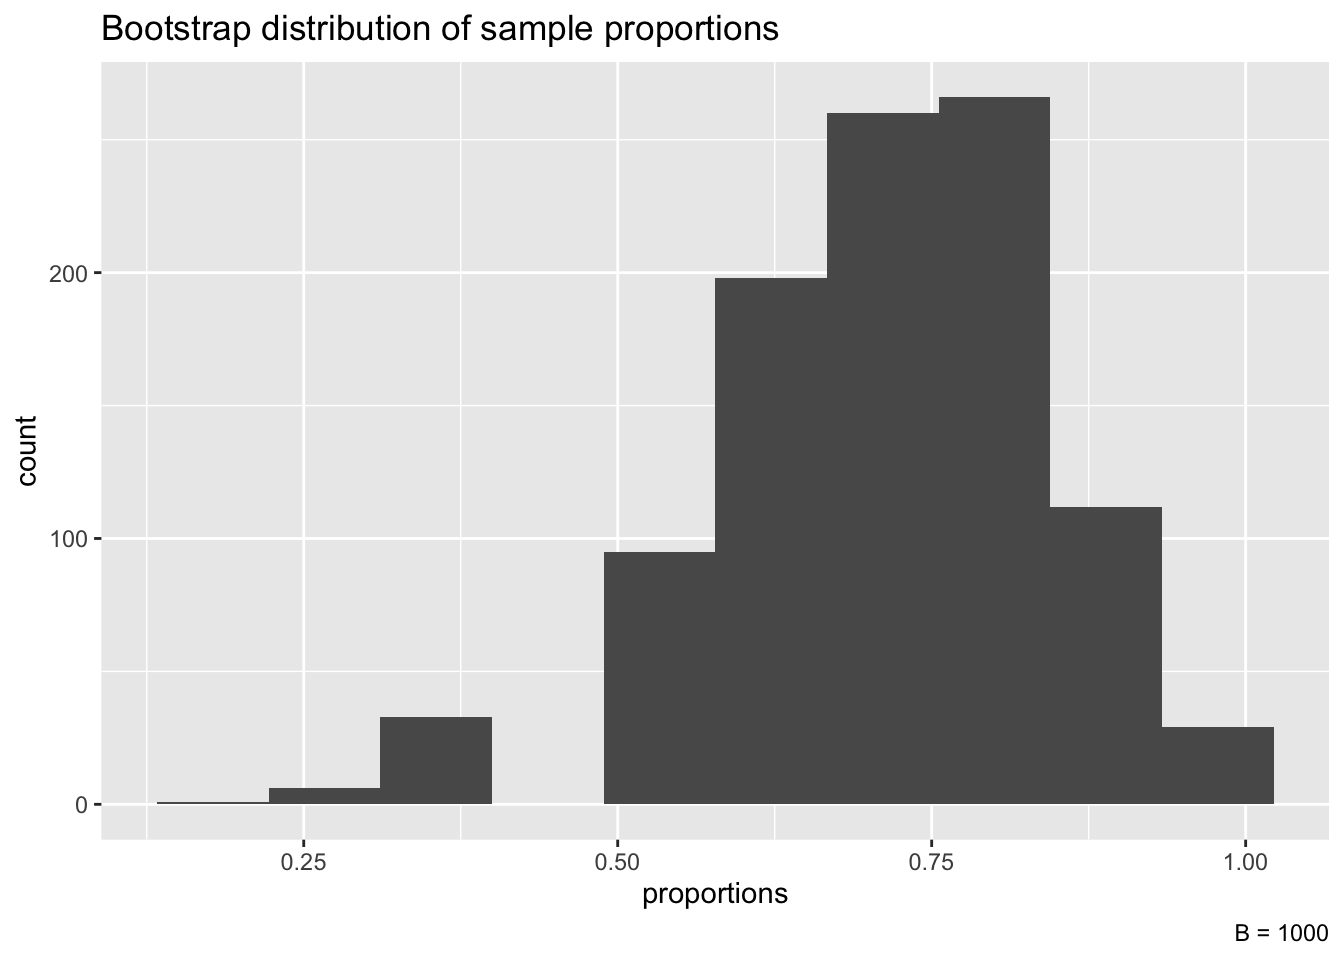
ggplot(boot_df, aes(x = bootstrapped_props)) +
geom_histogram(bins = 10) +
labs(x = "proportions",
title = "Bootstrap distribution of sample proportions",
caption = paste0("B = ", B))