# install the package if necessary!
library(nycflights23)
library(tidyverse)Class Notes
With Prof. Lyford
These are the live code notes from Professor Lyford. Note that there’s another set of notes on the schedule that gives more detailed descriptions of these functions using the books dataset from Wednesday!
#What is the average departure delay for each carrier's flights?
# (By carrier, what is the avg flight delay?)

#The long way:
flights |>
  filter(carrier == "DL") |>
  summarize(mean_delay = mean(dep_delay, na.rm = TRUE))
# A tibble: 1 × 1
mean_delay
<dbl>
1 15.1flights |>
filter(carrier == "AA") |>
summarize(mean_delay = mean(dep_delay, na.rm = TRUE))# A tibble: 1 × 1
mean_delay
<dbl>
1 14.2group_by() for grouped operations
#Introducing "group_by()"
flights |>
  group_by(carrier) |>
  summarize(mean_delay = mean(dep_delay, na.rm = TRUE))
# A tibble: 14 × 2
carrier mean_delay
<chr> <dbl>
1 9E 7.44
2 AA 14.2
3 AS 12.0
4 B6 23.8
5 DL 15.1
6 F9 35.7
7 G4 3.98
8 HA 22.9
9 MQ 10.5
10 NK 18.2
11 OO 19.8
12 UA 17.6
13 WN 16.1
14 YX 4.21flights |>
filter(!is.na(dep_delay)) |>
group_by(carrier) |>
summarize(mean_delay = mean(dep_delay, na.rm = TRUE))# A tibble: 14 × 2
carrier mean_delay
<chr> <dbl>
1 9E 7.44
2 AA 14.2
3 AS 12.0
4 B6 23.8
5 DL 15.1
6 F9 35.7
7 G4 3.98
8 HA 22.9
9 MQ 10.5
10 NK 18.2
11 OO 19.8
12 UA 17.6
13 WN 16.1
14 YX 4.21arrange() to sort rows
flights |>
  group_by(carrier) |>
  summarize(mean_delay = mean(dep_delay, na.rm = TRUE)) |>
  arrange(-mean_delay)
# A tibble: 14 × 2
carrier mean_delay
<chr> <dbl>
1 F9 35.7
2 B6 23.8
3 HA 22.9
4 OO 19.8
5 NK 18.2
6 UA 17.6
7 WN 16.1
8 DL 15.1
9 AA 14.2
10 AS 12.0
11 MQ 10.5
12 9E 7.44
13 YX 4.21
14 G4 3.98flights |>
filter(dep_delay > 0) |>
group_by(carrier) |>
summarize(mean_delay = mean(dep_delay, na.rm = TRUE)) |>
arrange(-mean_delay)# A tibble: 14 × 2
carrier mean_delay
<chr> <dbl>
1 OO 66.6
2 F9 63.1
3 AA 55.7
4 B6 55.7
5 NK 51.8
6 UA 45.7
7 DL 44.8
8 9E 44.8
9 AS 43.4
10 YX 43.4
11 G4 41.0
12 HA 40.9
13 WN 29.3
14 MQ 27.2#Let's find the average departure delay by origin
flights |>
filter(dep_delay > 0) |>
group_by(origin) |>
summarize(mean_delay = mean(dep_delay, na.rm = TRUE)) |>
arrange(-mean_delay)# A tibble: 3 × 2
origin mean_delay
<chr> <dbl>
1 JFK 50.4
2 LGA 47.7
3 EWR 45.7select() to choose certain columns
flights |>
  select(carrier, dep_delay)
# A tibble: 435,352 × 2
carrier dep_delay
<chr> <dbl>
1 UA 203
2 DL 78
3 B6 47
4 B6 173
5 UA 228
6 AA 3
7 B6 10
8 AA -6
9 UA 17
10 NK 2
# ℹ 435,342 more rowsflights |>
select(carrier, dep_delay, arr_delay, air_time) |>
group_by(carrier) |>
summarize_all(mean, na.rm=T) # this can be a helpful function!# A tibble: 14 × 4
carrier dep_delay arr_delay air_time
<chr> <dbl> <dbl> <dbl>
1 9E 7.44 -2.23 79.1
2 AA 14.2 5.27 166.
3 AS 12.0 0.0844 331.
4 B6 23.8 15.6 161.
5 DL 15.1 1.64 179.
6 F9 35.7 26.2 137.
7 G4 3.98 -5.88 107.
8 HA 22.9 21.4 623.
9 MQ 10.5 0.119 118.
10 NK 18.2 9.89 154.
11 OO 19.8 13.7 105.
12 UA 17.6 9.04 173.
13 WN 16.1 5.76 149.
14 YX 4.21 -4.64 80.9piping directly into ggplot()
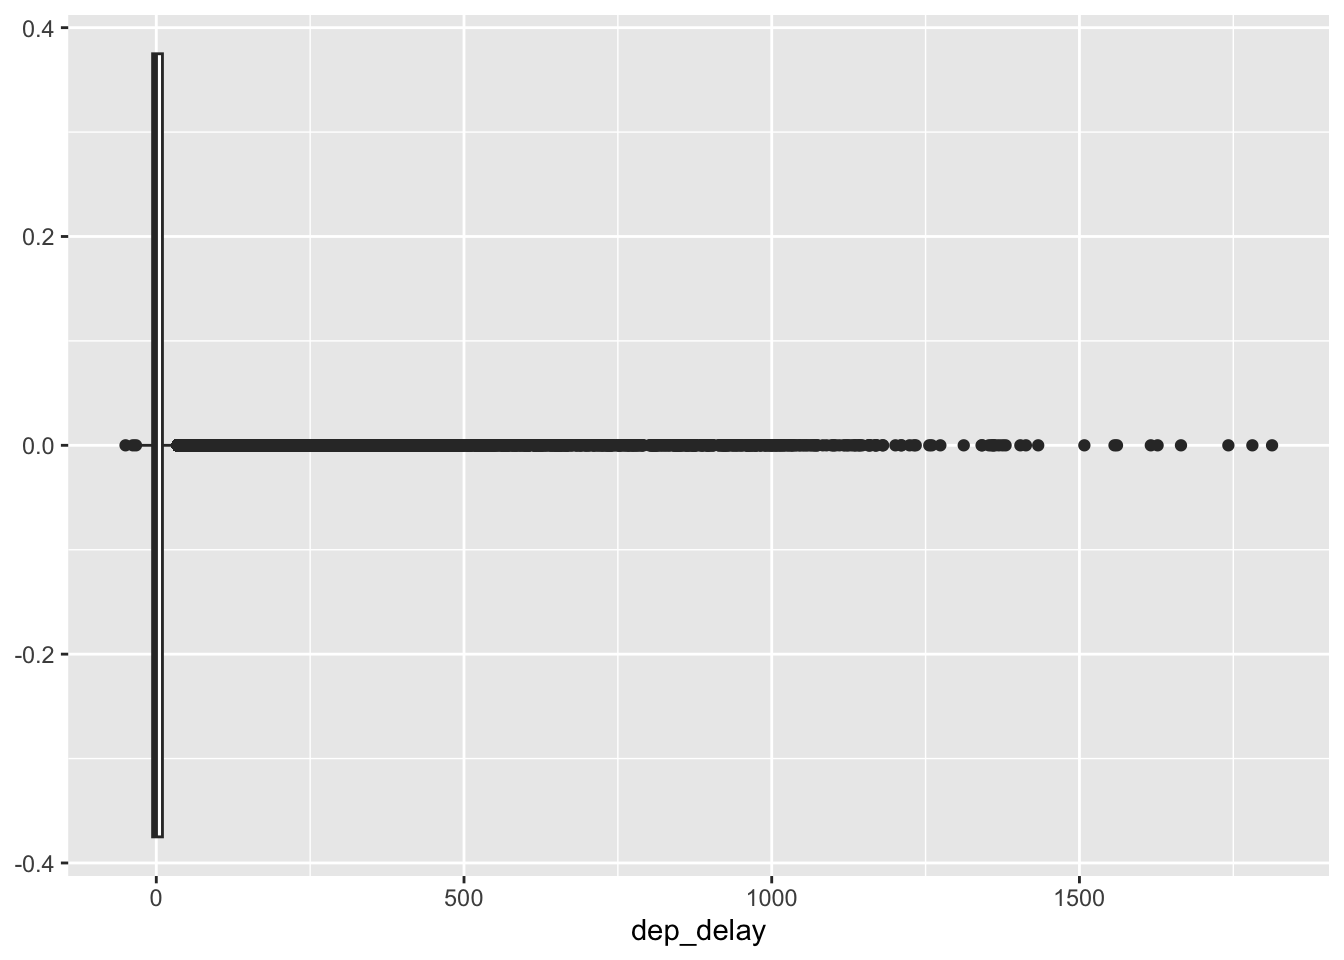
#Let's make a graph of all departure delays
flights |>
  ggplot() +
  geom_boxplot(aes(x = dep_delay))
Warning: Removed 10738 rows containing non-finite outside the scale range
(`stat_boxplot()`).