library(tidyverse)
library(openintro)Hypothesis test for single mean (CLT)
Data salinity come from openintro.
# visualize and get a feel for the data (important for CLT conditions)
x <- salinity$salinity_ppt
n <- length(x)
ggplot(salinity, aes(x = salinity_ppt)) +
  geom_histogram(bins = 10)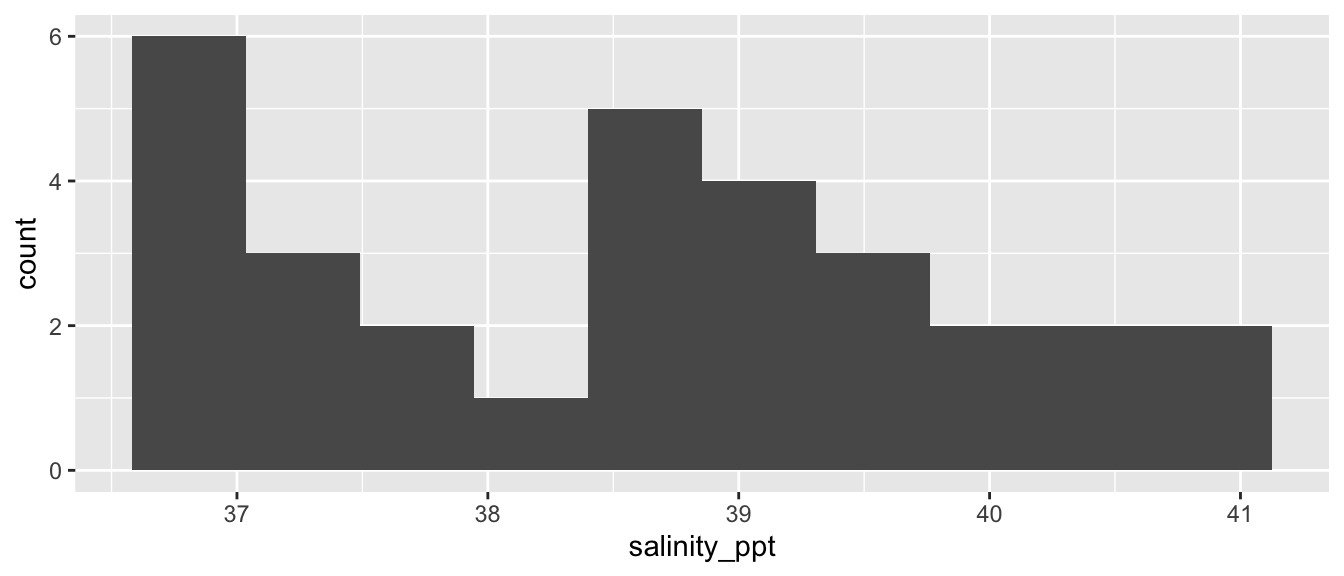
# create test statistic
xbar <- mean(x)
s <- sd(x)
mu0 <- 38
se <- s / sqrt(n)
t <- (xbar - mu0)/se
t
[1] 2.543329# obtain p-value for two-sided H_A
df <- n-1
# option 1 (relies on knowing that t is positive)
p_val <- 2 * (1 - pt(t, df))
p_val[1] 0.01657298# option 2 (relies on knowing that t is positive)
p_vale <- 2 * pt(-t, df)
# option 3: works no matter if t is positive or negative
p_val <- 2 * (1 - pt(abs(t), df))
p_val[1] 0.01657298