Data wrangling with dplyr

2025-09-24

Grammar of data wrangling

  • Recall: data frames are objects in R that store tabular data in tidy form

  • The dplyr package (included in tidyverse package) uses the concept of functions as verbs that manipulate data frames.

    • filter(): pick rows matching criteria
    • mutate(): add new variables as columns
    • summarise(): reduce variables to quantitative values
    • group_by(): for grouped operations based on a variable
    • distinct(): filter for unique rows
    • select(): pick columns by name
    • slice(): pick rows using indices
    • and many more!!!

Rules of dplyr functions

  1. The first argument is always a data frame
  2. Subsequent argument(s) say what to do with that data frame
    1. We connect lines to code using a pipe operator (see next slide)
  3. Always return a data frame

Pipes

  • In programming, a pipe is a technique for passing information from one process to another

  • In dplyr, the pipes are coded as |> (i.e. vertical bar and greater than sign)

    • Not to be confused with + used to add layers in ggplot
  • We can think about pipes as following a sequence of actions which provide a more natural and easier to read structure

  • For example: suppose that in order to get to work, I need to find my car keys, start my car, drive to work, and then park my car

  • Expressed using pipes, this may look like:
find("car_keys") |>
  start_car() |>
  drive(to = "work") |>
  park()
  • Expressed as a set of nested R pseudocode, this may look like:
park(drive(start_car(find("car_keys")), 
           to = "work"))

Logical operators in R

It is common to compare two quantities using logical operators. All of these operators will return a logical TRUE or FALSE. List of some common operators:

  • <: less than

  • <=: less than or equal to

  • >: greater than

  • >=: greater than or equal to

  • ==: (exactly) equal to

  • !=: not equal to

1 < 4
[1] TRUE
2 == 5
[1] FALSE
2 != 5
[1] TRUE

Logical operators (cont.)

We might also want to know if a certain quantity “behaves” a certain way. The following also return logical outputs:

  • is.na(x): test if x is NA

  • x %in% y: test if x is in y

  • !x: not x

is.na(NA)
[1] TRUE
is.na("apple")
[1] FALSE
3 %in% 1:10
[1] TRUE
!TRUE
[1] FALSE

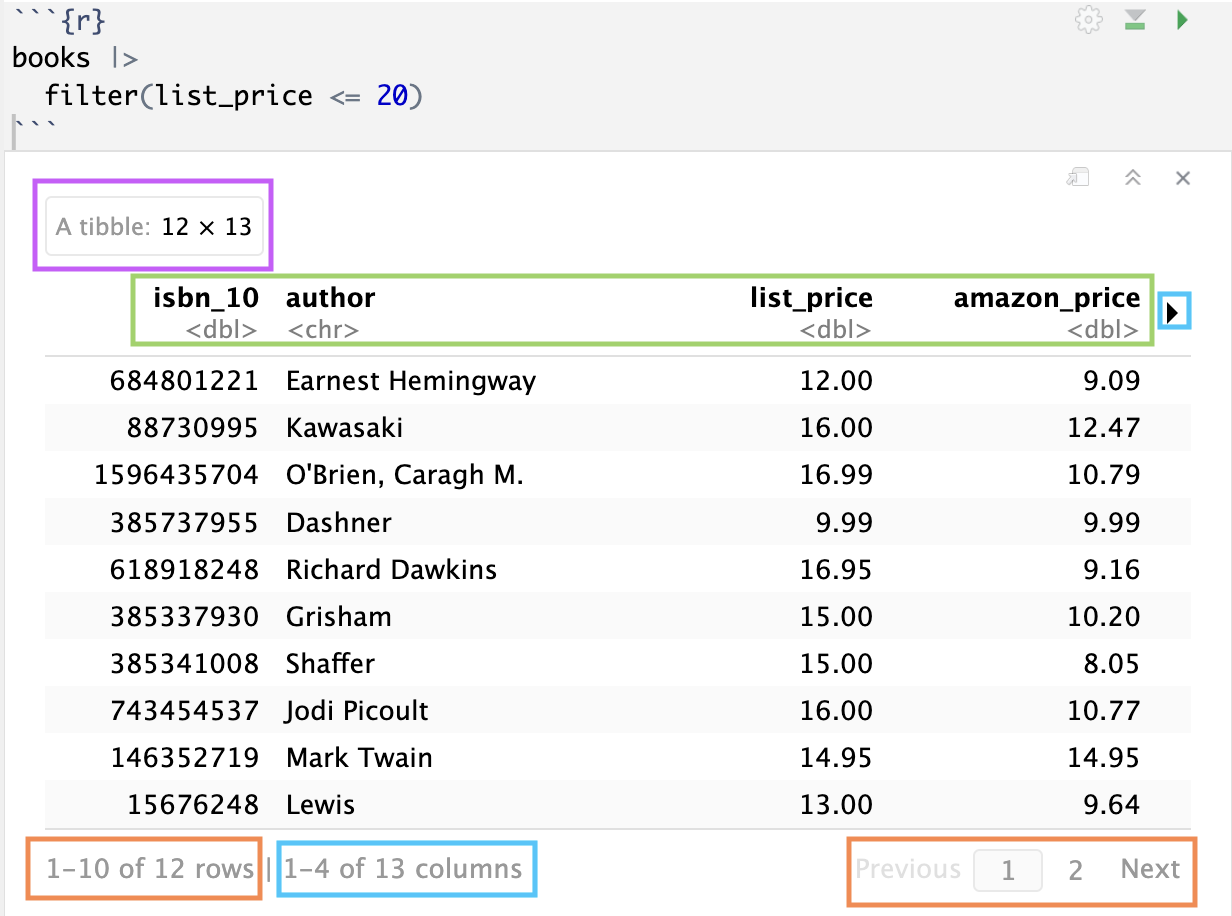
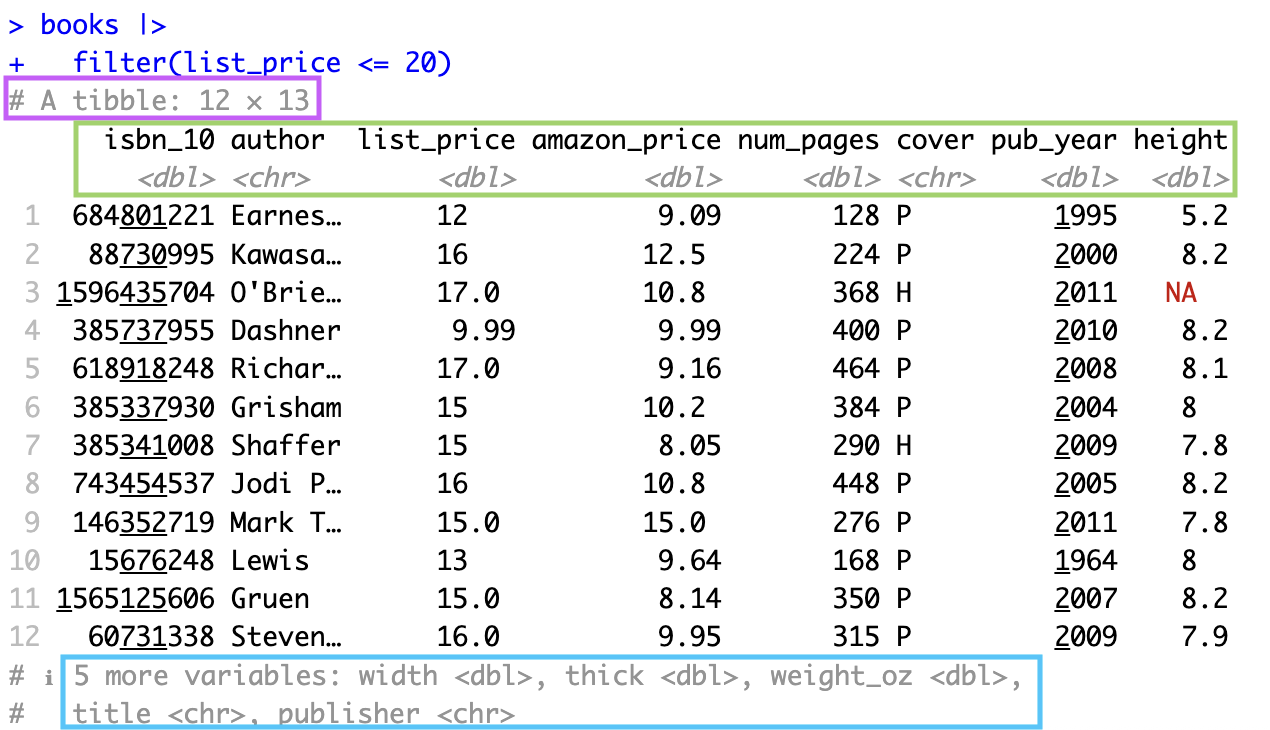
Working with data frames in RStudio

If executed code output in Source

If executed code output in Console

  • Tibble (i.e. data frame) with 12 observations and 13 variables

  • For variables shown, their names and types

    • Variables not displayed. In Source, you can click to see other variables.

  • Source will display at most 10 observations, but you can click to see more.

Live code

Data from Amazon: we have data about several books available for purchase from Amazon. I took a random sample from the original sample of 325 cases from the original dataset.

Copy and paste the following line of code into a new code chunk in your live code! We will load in the data together and take a quick look at it before diving into data wrangling

url_file <- "https://raw.githubusercontent.com/midd-stat201a-fall25/midd-stat201a-fall25.github.io/refs/heads/main/data/amazon_books.csv"