Sampling distribution
2025-10-06
Activity
While you’re coming into the room, please take 1 card. Then:
On the unlined side, write down “berry” if you pronounce Middlebury as Middle-“berry”, and “bury” if you pronounce it as Middle-“burry”.
On the lined side, write down the average number of hours of sleep you get per night
Then bring these to Prof. Tang
Housekeeping
Problem Set 4 due tonight!
Midterm 1 updates
Today’s content is NOT on midterm
Where we are going
We are shifting focus from EDA and beginning to enter the world of statistical inference and modeling!
Want to answer questions about a population, but must rely on a sample
Collect data from sample –> calculate statistics
What can we say about the statistics?
Data are random! So how sure are we about our conclusions?
Statistics starts here!
Inference
Statistical inference is the process of using sample data to make conclusions about the underlying population the sample came from
Estimation: using the sample to estimate a plausible values for the unknown parameter
Testing: evaluating whether our observed sample provides evidence for or against some claim about the population
Research questions involving estimation
Examples:
What proportion of Middlebury students pronounce the college’s name as Middle-“berry”?
What is the average number of hours of sleep Middlebury students get a night?
Questions here are about a population parameter
- If we have a census, we can answer the question immediately.
- If we only have a sample, we have to do our best to answer the question using our data \(x_{1}, x_{2},\ldots, x_{n}\)
Activity
What proportion of Middlebury STAT 201A students pronounce Middlebury as Middle-“berry”?
Target population:
Sampling method:
Population parameter:
Are we able to compute the value of the parameter, or do we need to calculate a statistic?
What proportion of Middlebury students pronounce Middlebury as Middle-“berry”?
Target population:
Sampling method:
Population parameter:
Are we able to compute the value of the parameter, or do we need to calculate a statistic?
Practice
We are often interested in estimating a population mean or proportion. Let’s make sure we feel comfortable telling the difference.
For each of the following situations, state whether the parameter of interest is a mean or a proportion.
- In a survey, one hundred college students are asked how many hours per week they spend on the Internet.
- In a survey, one hundred college students are asked whether or not they use ChatGPT for homework assignments.
- In a survey, smart phone users are asked how many times they used a web-based taxi service over the last year.
- In a sample of one hundred recent college graduates, it is found that 85 percent expect to get a job within one year of their graduation date.
Point estimate
Sample proportion \(\hat{p}\) is a very sensible estimate for true proportion \(p\)
\(\hat{p}\) is an example of a point estimate: a single number used to estimate a true but unknown population parameter
i.e. a point estimate is a statistic with a specific purpose
Other examples include sample mean \(\bar{x}\) for true mean \(\mu\), and \(s\) for \(\sigma\)
What might be a desirable characteristic of a “good” point estimate?
- Do we expect that the sample statistic will equal the population parameter? (e.g. how likely is it that \(\bar{x} = \mu\) or \(\hat{p} = p\) exactly?) Why or why not?
Variability of statistic
Two datasets collected under identical sampling procedures will almost always differ due to variability in the sample.
As a result, values of the point estimate/sample statistic that we calculate from the different samples will also exhibit variability
- e.g. value of \(\hat{p}\) from sampling STAT 201A would look different from \(\hat{p}\) obtained from sampling STAT 201B
Sampling distribution of the statistic: how the statistic behaves under repeated random samples obtained via the same sampling procedure
The variability associated with the sampling distribution of the statistic is called the standard error
- Note: “error” \(\neq\) bad
This is in contrast to the standard deviation, which describes variability in the individual data points and not the statistic
Different distributions
Population distribution: distribution of the variable of interest for everyone in the population
- Has associated variability \(\sigma\)
Sample distribution: distribution of the data from a single sample
- Has associated variability \(s\)
Sampling distribution: distribution of sample statistics calculated from the data obtained from multiple samples
- Has associated variability standard error \((SE)\)
Recall candy activity
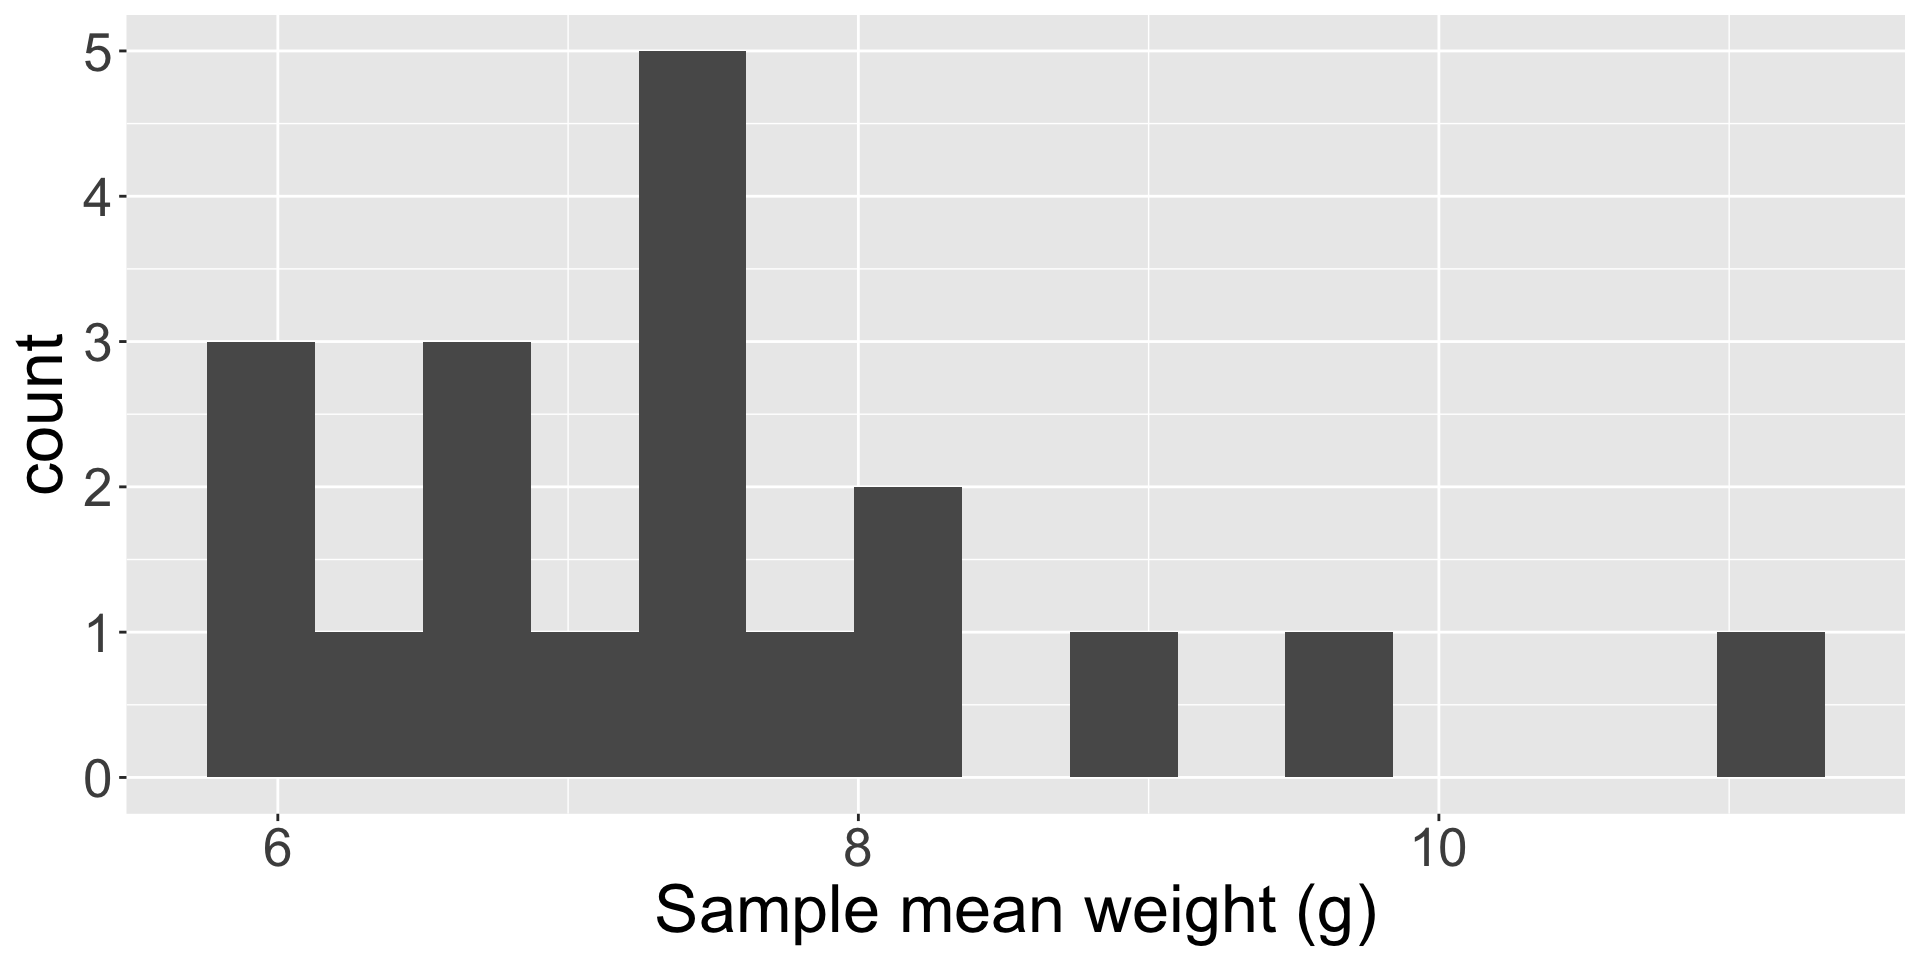
At the beginning of the semester, I passed around a bag of candy and everyone took out 5 pieces at random, and measured the average weight.
What was the parameter of interest? What sample statistic did you calculate?
The histogram visualizes your sample mean weights.
Does this histogram visualize the population distribution, the sample distribution, or the sampling distribution of a statistic?
Candy activity (cont.)
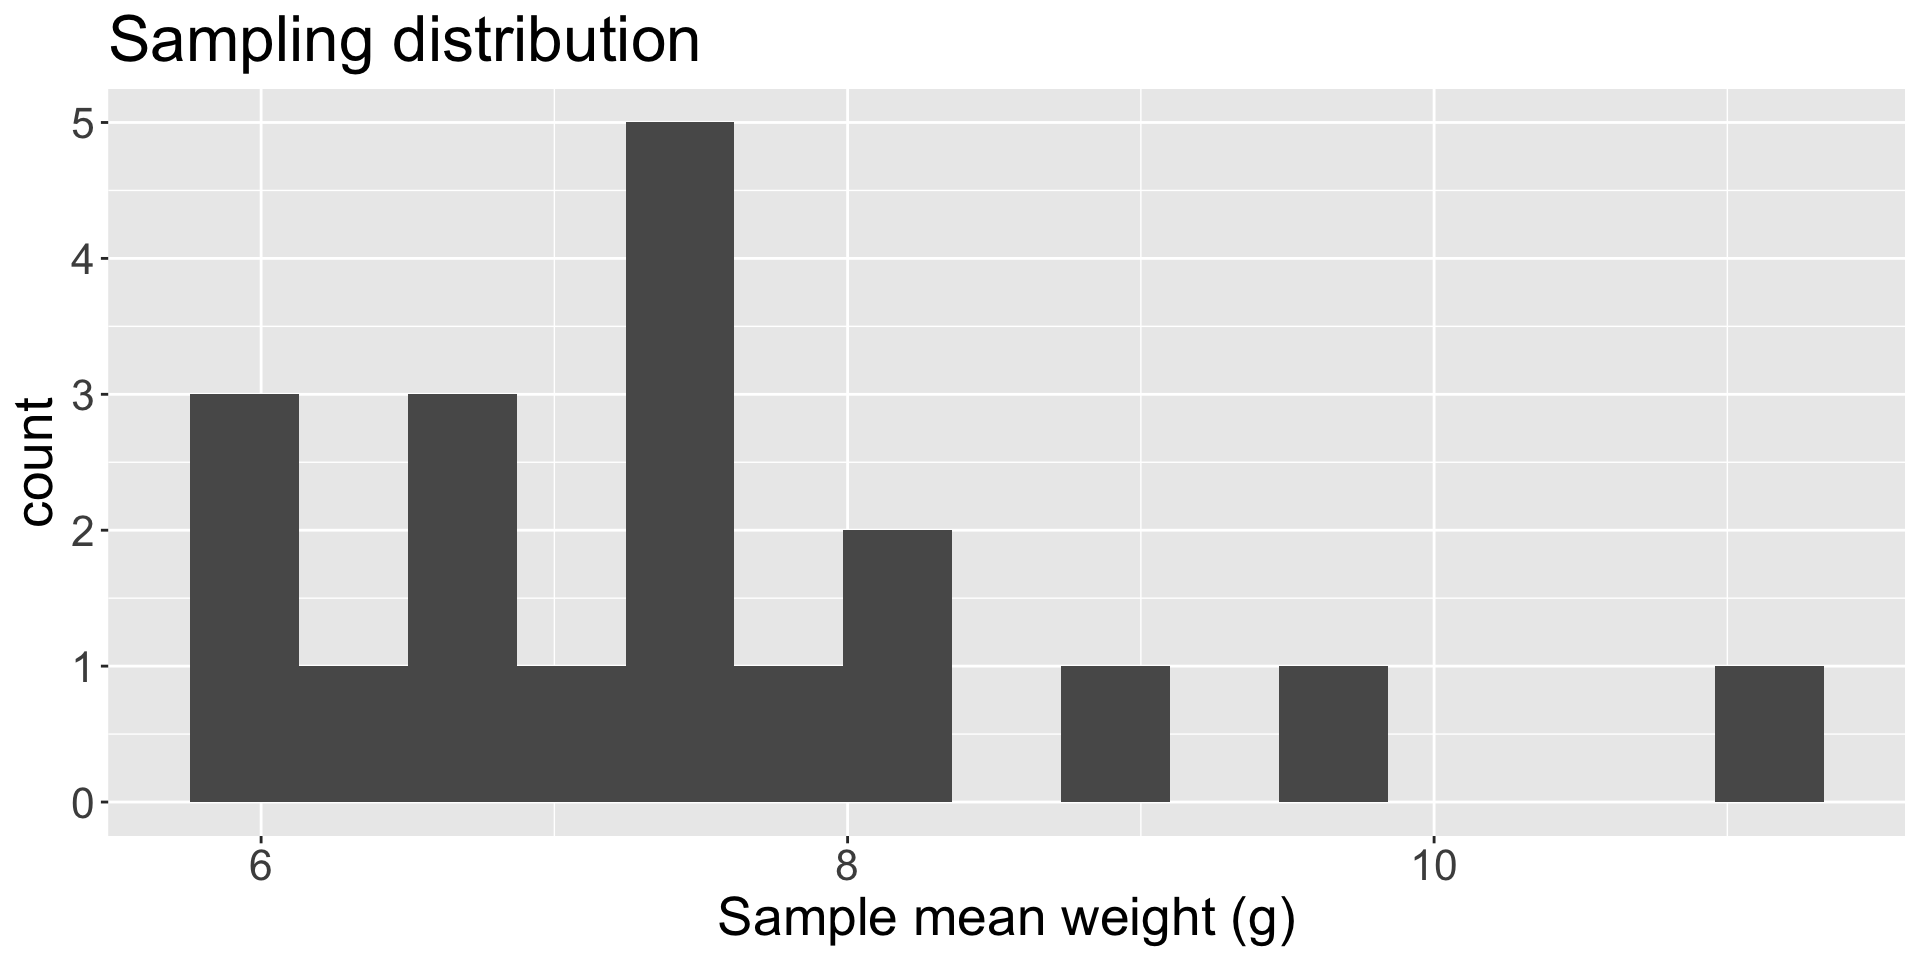
Each one of the values in the histogram is a sample mean \(\bar{x}\) (i.e. a sample statistic)
Thus, the histogram visualizes the sampling distribution of the sample mean
- The mean of these sample means is 7.49 grams, with \(SE=\) 1.34
Comprehension questions
Do we typically get to observe the sampling distribution?
- If not, why should we care about them?
What are the differences between a population distribution, a sample distribution, and a sampling distribution? What are their associated variability?